Shortcut: wd:WDQS/Result viewsWikidata:SPARQL query service/Wikidata Query Help/Viste dei risultati
.png)

.png)

Questa pagina aiuta a comprendere le varie possibilità di visualizzazione dei risultati su Servizio query SPARQL.
La pagina degli esempi di query contiene molti buoni esempi che puoi provare!
Open the WDQS interface and then:
- select your language in
 of the upper tool bar.
 - write a valid SPARQL code in the text area.
- check your script by hovering the elements with your mouse; tooltips appear and should be consistent with what you intend to do. They adopt the language you have selected (default to english).
- then click on blue button Execute query of the sidebar to launch the request. Red square is lit in the sidebar while the command executes.
- Dopo l'esecuzione di una query, puoi scegliere mediante il pulsante "Aspetto" quale vista utilizzare per mostrare il risultato. Le viste disponibili dipendono dalla query e dal tipo di dati.
| Source example |
|---|
# Recent events
SELECT ?event ?eventLabel ?date
WHERE
{
  # find events
  ?event wdt:P31/wdt:P279* wd:Q1190554.
  # with a point in time or start date
  OPTIONAL { ?event wdt:P585 ?date. }
  OPTIONAL { ?event wdt:P580 ?date. }
  # but at least one of those
  FILTER(BOUND(?date) && DATATYPE(?date) = xsd:dateTime).
  # not in the future, and not more than 31 days ago
  BIND(NOW() - ?date AS ?distance).
  FILTER(0 <= ?distance && ?distance < 31).
  # and get a label as well
  OPTIONAL {
    ?event rdfs:label ?eventLabel.
    FILTER(LANG(?eventLabel) = "en").
    }
}
# limit to 10 results so we don't timeout
LIMIT 10
|
Note: You can also run directly a hardcoded request via the TryIt links of this page. When it brings you directly to the result display you can always return to the source script unsing the link at the bottom of the interface.
Table (default)
Mostra i dati in forma tabellare. È la "vista di default" per i risultati e può mostrare tutti i tipi di dati.
Mapperà ogni variabile dalla clausola select SPARQL a una colonna della tabella formattata.
-
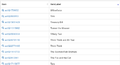 Risultato tabellare
 -
 Risultato tabellare su schermo piccolo con le colonne invertite


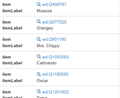
Image Grid

Mostra i dati come una griglia con immagini.
Ogni elemento della griglia ha una grande immagine e quando si clicca sopra si apre la galleria.
Contents an item is the formatted row data.
| Variabile | Tipo di dato | Mapping | Descrizione |
|---|---|---|---|
| * | File multimediale su Commons | Elemento della griglia | Image columns will create a grid item. |
Le righe che non contengono immagini saranno ignorate.
It’s nonetheless possible to include no image rows in the result by modifying the sparql by including a default image in case the image variable is not bound:
  optional {
    ?item wdt:P18 ?img_ .
  }
  bind (if(bound(?img_),
           ?img_,
           <http://commons.wikimedia.org/wiki/Special:FilePath/File:Profile_avatar_placeholder_large.png>) as ?image) # [[:commons:File:Profile_avatar_placeholder_large.png]] as a placeholder
Here the file commons:File:Profile avatar placeholder large.png is used as a placeholder, you can use your own.
Options
| Option name | Type | Description |
|---|---|---|
hide
|
One or more variable names (strings, starting with ?), single value or array
|
Don’t show these variables in the result. |
Map
Mostra i dati come mappa con Open Street Map.
| Variabile | Tipo di dato | Mapping | Descrizione |
|---|---|---|---|
| * | Coordinate geografiche | Map Marker | Le colonne creeranno un marcatore suilla mappa.
Il contenuto del marcatore è il dato grezzo formattato. |
| ?layer | Map Marker Layer | Creates a colored map layer that allows filtering. | |
| ?rgb | Color | Color Map Marker | Example 000000 for black color. |


Technically, any well-known text literal can be displayed, not just a point coordinate.
Non-point geometry values are never stored on Wikidata, but they can be constructed in SPARQL using functions like CONCAT() and STRDT() –
see this map of Czech railway lines for an example of LINESTRING() geometry.
Options
specify using e.g. #defaultView:Map{"hide":["?foo", "?bar"],"layer":"?bar"}, using an array when there are multiple variables.
| Option name | Type | Description |
|---|---|---|
hide
|
One or more variable names (strings, starting with ?), single value or array
|
Don’t show these variables in the result. |
layer
|
One or more variable names (strings, starting with ?), single value or array
|
Use these variables for the map layer, instead of the default ?layerLabel, ?layer.
|
markercluster
|
boolean or object |
|
Line, Bar, Scatter and Area Chart
Mostra uno dei seguenti tipi di grafico.
| Variabile | Tipo di dato | Mapping | Descrizione |
|---|---|---|---|
| * | Numero
Etichetta Data e ora |
Asse X
Asse Y |
Il primo sarà l'asse X, il secondo l'asse Y |
| * | Etichetta | Category / Legend Item (optional) | Will only be used after the above are mapped |
| * | Etichetta | Storyboard / Animation (optional) | Will only be used after the above are mapped |
-
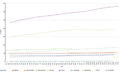 Line Chart Provalo
 -
 Area Chart Provalo
 -
Bar Chart (animazione) Provalo
-
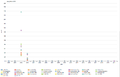 Scatter Chart (animazione) Provalo


Bubble Chart

Mostra un grafico a bolle in cui la dimensione e il colore delle bolle possono essere configurate.
Quando viene fornito un elemento, la bolla sarà collegata a Wikidata.org.
| Variabile | Tipo di dato | Mapping |
|---|---|---|
| * | Etichetta | Etichetta della bolla |
| * | Numero | Dimensione della bolla |
| * | Elemento | Link della bolla (opzionale) |
| ?rgb | Colore | Colore della bolla (opzionale) |
Tree Map

Mostra una mappa ad albero zoomabile.
| Variabile | Tipo di dato | Mapping | Descrizione |
|---|---|---|---|
| * | Etichetta | Etichetta | La 1ª etichetta nella riga sarà il 1º livello della tree map.
La 2ª etichetta sarà il 2º livello. La 3ª etichetta sarà il 3º livello. |
| * | Elemento | Link (opzionale) | |
| * | Quantity | Size |
Tree
Shows an expandable tree.

| Variable | Data Type | Mapping | Description |
|---|---|---|---|
| * | Item | Node ID | First item will be a root node the following items in the same row will be nested. |
| * | Label | Node Label (optional) | Labels will be appended to current node. |
| * | Number | Node Label (optional) | |
| * | Commons Media | Item image |
Timeline

Mostra una linea temporale esplorabile.
| Variabile | Tipo di dato | Mapping | Descrizione |
|---|---|---|---|
| * | Data e ora | Item Point in Time
Item End Point in Time |
First date in a row sets the item position in the timeline.
If a second date is present a start and end date will be set. |
| * | File multimediale su Commons | Item image |
Options
| Option name | Type | Description |
|---|---|---|
hide
|
One or more variable names (strings, starting with ?), single value or array
|
Don’t show these variables in the result. |
Dimensions

Shows dimension and their links.
It also allows filtering them by selecting an axis fraction.
This type of graph is also known as parallel coordinates.
| Variabile | Tipo di dato | Mapping | Descrizione |
|---|---|---|---|
| * | Etichetta | Dimensione | Every column in the result row is mapped to a dimension |
| * | Numero | ||
| * | Data e ora |
Graph
Shows an interactive graph that allow hierarchically ordering and exploring items.
| Variabile | Tipo di dato | Mapping | Descrizione |
|---|---|---|---|
| * | Elemento | Node ID | First item in a row of output variables will have an arrow pointing to the items in the same row. |
| * | Etichetta | Node Label (optional) | |
| * | File multimediale su Commons | Node Image (optional) | |
| ?rgb | Colore | Node Color (optional) | Color of the item just before the rgb variable. Example 000000 for black color. |
| * | Numero | Node Size (optional) | |
| ?edgeLabel | Label | Edge Label (optional) |
-
 Graph
Graph -

Additional Information
RDF Data Type Mapping
| RDF Type | RDF Data Type | Constraint | Tipo di dato |
|---|---|---|---|
| URI | Stringhe che iniziano con http://www.wikidata.org/entity/Q |
Entity | |
| URI | Stringhe che iniziano con http://commons.wikimedia.org/wiki/Special:FilePath |
File multimediale su Commons | |
| Literal | http://www.w3.org/2001/XMLSchema#dateTime | DateTime | |
| Literal | http://www.opengis.net/ont/geosparql#wktLiteral | Coordinate | |
| Literal | http://www.w3.org/2001/XMLSchema#double
http://www.w3.org/2001/XMLSchema#float http://www.w3.org/2001/XMLSchema#decimal http://www.w3.org/2001/XMLSchema#integer http://www.w3.org/2001/XMLSchema#long http://www.w3.org/2001/XMLSchema#int http://www.w3.org/2001/XMLSchema#short http://www.w3.org/2001/XMLSchema#nonNegativeInteger http://www.w3.org/2001/XMLSchema#positiveInteger http://www.w3.org/2001/XMLSchema#unsignedLong http://www.w3.org/2001/XMLSchema#unsignedInt http://www.w3.org/2001/XMLSchema#unsignedShort http://www.w3.org/2001/XMLSchema#nonPositiveInteger http://www.w3.org/2001/XMLSchema#negativeInteger |
Number | |
| Literal | Has no RDF Data Type | Label | |
| Literal | Ha proprietà xml:lang |
Label | |
| Literal | String matches /^[0-9A-F]{6}$/ |
Color |
Formattazione
C'è una formattazione speciale per i seguenti tipi di dati:
| Tipo di dato | Formato |
|---|---|
| Entity | Collegamento a Wikidata.org
Label is shortened to wd:Qxx Explore an item (magnify icon) |
| DateTime | MM DD, YYYY
Tooltip shows raw ISO timestamp |
| Commons Media | Collegamento a Commons.Wikimedia.org
Displaying Gallery ( image icon ) |
Mobile / Responsive
Result views are made to work on different devices and resolutions. Their appearance may change depending on the space they can use.
Embed Mode
Result views can be linked or embedded via iframes. You can get the regarding link or code by clicking Link in the above menu.
See the difference: link to a query e link to a result or the embed code:
<iframe style="width:80vw; height:50vh;" scrolling="yes" frameborder="0" src="http://tinyurl.com/zwf4k2w">
Download results

There are several ways to export the results of a query.
JSON, TSV and CSV are three different open-standard formats to download the data, offered under the Download tab. To get results in XML format, click on Link > SPARQL endpoint.
You can also download some of the graphic views as a SVG file: this feature works with all the views except table, image grid, timeline, graph builder, map, and graph.
Default View
The default view can be change for each SPARQL query by using a comment:
#defaultView:[NAME]
Per esempio:
#defaultView:ImageGrid
Result view options
Result views can be configured with various options, which are specified in JSON (Q2063) format, either following the defaultView comment (see previous section) or following a separate view comment.
#defaultView:Map{"layer": "?typeLabel"}
#view:ImageGrid{"hide": "?coords"}
Title
Result views can show a title. The title can be set via a title comment.
#title:A title of your choice
List of WDQS tags
| WDQS tag | Display options | Notes |
|---|---|---|
| #defaultView:Table | Table | default format when omitted |
| #defaultView:ImageGrid | Image grid | |
| Graph builder | access to the graph builder tool | |
| #defaultView:Map | Map | |
| #defaultView:LineChart | Line chart | |
| #defaultView:BarChart | Bar chart | |
| #defaultView:ScatterChart | Scatter chart | |
| #defaultView:AreaChart | Area chart | |
| #defaultView:BubbleChart | Bubble chart | |
| #defaultView:TreeMap | Tree map | |
| #defaultView:Tree | Tree | |
| #defaultView:Timeline | Timeline | |
| #defaultView:Dimensions | Dimensions | |
| #defaultView:Graph | Graph | |
| #title: | title of the WDQS results frame | |
| #view: | equivalent to prefix #defaultView: |
Auto language
When using the magic keyword [AUTO_LANGUAGE] it is replaced by the users language when submitting the query. This allows writing a query with where the result is displayed in the users language.
Example:
#<span lang="en" dir="ltr" class="mw-content-ltr">Use language of the user for display labels and fallback to english as default</span>
SERVICE wikibase:label {
    bd:serviceParam wikibase:language "[AUTO_LANGUAGE],en" .
}
Auto coordinates
When using the magic keyword [AUTO_COORDINATES] it is replaced by the users location when submitting the query (with clients accepting the geolocalization). This allows writing a query with the users' location.
Example:
#defaultView:Map
SELECT ?place ?coordinate_location ?dist {
SERVICE wikibase:around {
    ?place wdt:P625 ?coordinate_location.
    bd:serviceParam wikibase:center "[AUTO_COORDINATES]".
    bd:serviceParam wikibase:radius "1".
    bd:serviceParam wikibase:distance ?dist.
  }
}